

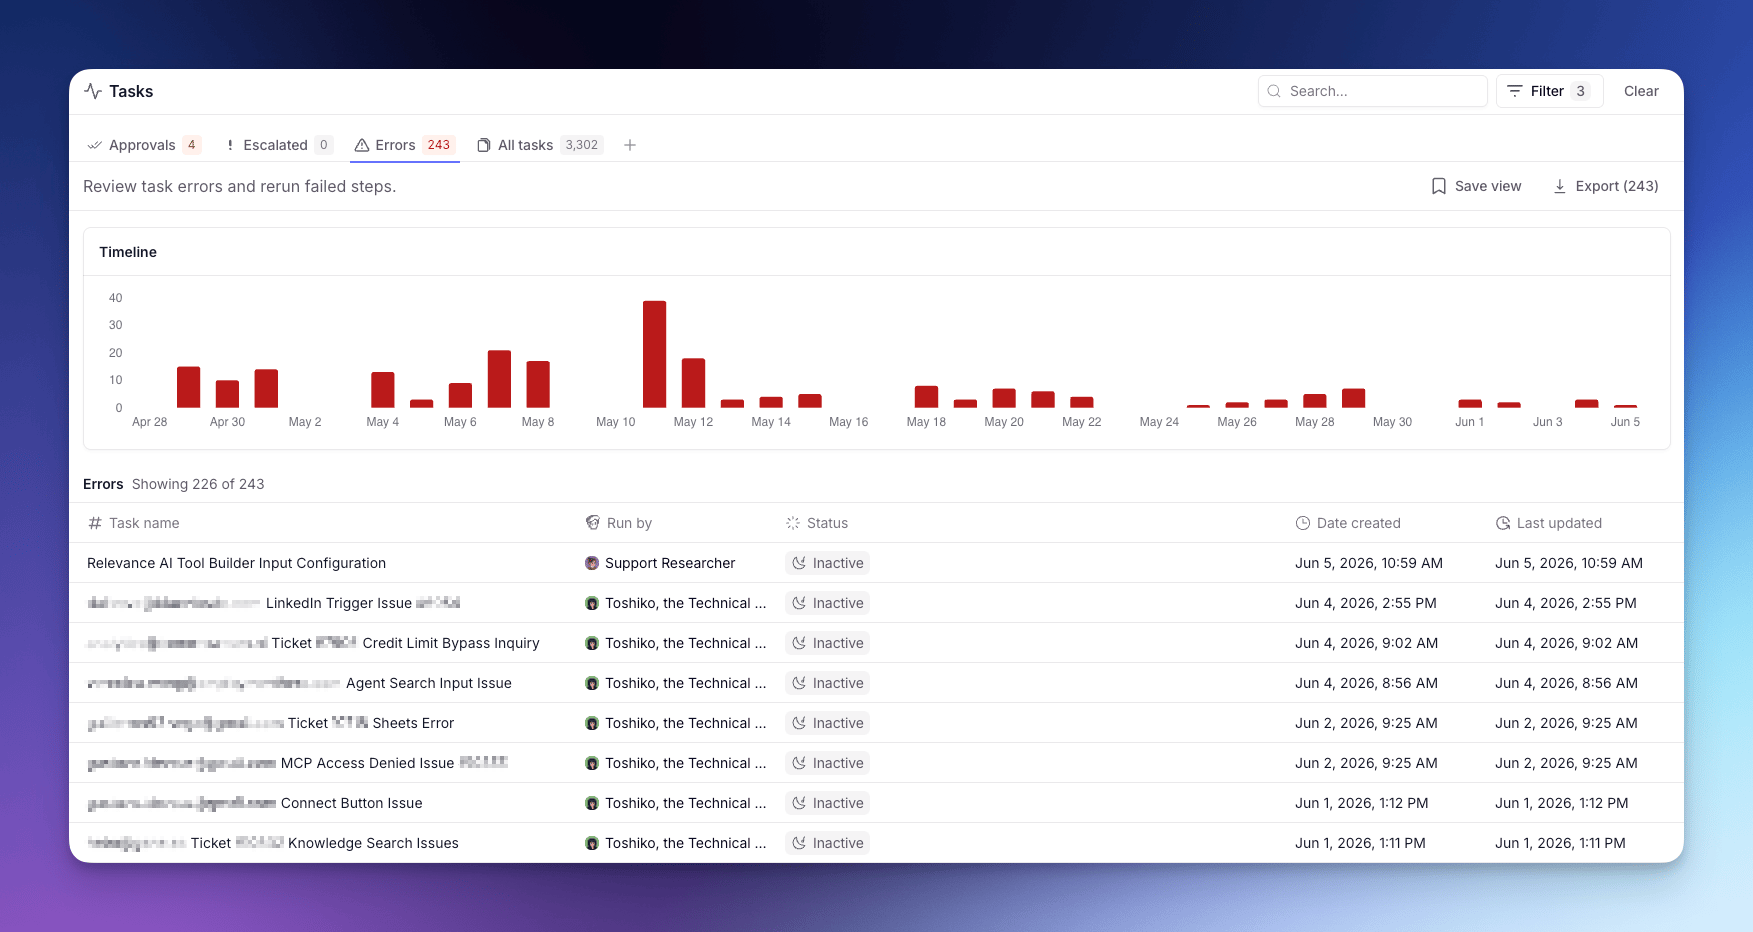
Each Task is a single run of work (a conversation or workflow) carried out by an Agent or Workforce. For what a Task is and how to read one, see Tasks.
Tabs
The page is split into tabs:- Approvals — Tasks waiting on your approval before they can continue.
- Escalated — Tasks the Agent paused on to ask you a question.
- Errors — Tasks that hit a Tool failure or runtime error.
- All tasks — every conversation across your Agents and Workforces.
Bulk actions
When you open a Task, the page checks for other Tasks from the same Agent in the same state and surfaces a bottom sheet so you can act on the whole group at once. Available bulk actions:- Approve or Reject pending approvals.
- Rerun errored Tasks from the failing step.
A Task with more than one pending approval isn’t bulk-actionable and stays one-at-a-time.
Cost visibility in task lists
The task list table includes Credits and Actions columns at the per-task row level. These show the credit spend and action count for each individual task run.The Credits and Actions columns in the task list are gated behind the
MonitorTaskCostEnrichment feature flag, which is off by default. This feature is rolling out progressively via PostHog — the columns may not be visible on all accounts immediately. Contact your account manager if you need early access.Cost breakdown modal
Clicking a Credits value in the task list row opens the cost breakdown modal for that task. The modal shows:- Total credits and actions consumed by the task
- A by source table splitting costs between task run spend and evaluation costs
- Collapsible detail sections for inspecting each cost source individually
This modal shows costs for a single task run. The cost breakdown accessible from the Analytics Workforce and Agent breakdown tables aggregates spend across all tasks for an agent or workforce.